Technology companies generally have an R&D department where people work with development. It’s taken for granted, just like having a finance department. But have you, as a manager, really thought about what you want to achieve with the R&D resources? It may seem like a silly question; Of course you know what the R&D department does and why. Or do you?
No, it’s not at all obvious. Although there may be a consensus and prioritization in the management team, in fact, R&D resources often put time and energy into something completely different. When I ask management what their intentions with R&D are, they respond – to develop new profitable products. When I ask the R&D engineers where they spend most of their time, it is about support for production and sales as well as continuous improvement of existing products. The projects that deal with future products fall far down the list of things to do. This is not the way to successful new product development
Introducing Parmatur Pulse creates transparency (and sometimes an initial shock when the actual situation becomes visible) that facilitates governance from the management team. That will enable you to focus R&D work according to the strategies, defined as focus areas with financial targets. In Pulse, the product team develops a strategic design within each focus area, with business goals and program plans, to achieve the strategic goals.
But it can still be difficult to see how ongoing and completed projects actually contribute to the strategic goals. With the Parmatur App you can now see both the health status of the projects and how the projects contribute to the business goals. The Parmatur App contains a product view where you enter sales profit and financial targets for the focus areas and projects. Reporting can be done weekly, bi-weekly or monthly. The more often it is possible to get current figures, the better the follow-up. By comparing these figures with the progress of the projects you can get an idea of the value that has been created and what remains to be done to meet the strategic goals.
By frequently measuring and presenting the actual situation, you create a sense of urgency. Strategic goals of three years may now seem far away, but within R&D you are actually in a hurry. Just think about how long it takes to start a project with proper foundations and the time it takes to complete the project, and then the time it takes to make a successful launch and then the time it takes until sales start to take off.
As the projects are ongoing, there will be a number of obstacles that prevent R&D from achieving the project goals and meeting the deadlines. This can be anything from resource allocation, lack of test equipment, production of prototype parts that are not given priority in production, to delivery times on prototypes and tools.
If you look at each obstacle, there are often financial explanations as to why we do not hire more staff, do not buy test equipment or build a prototype production line. And sometimes resources are simply used to handle the delivery of products because there is an emergency or capacity shortage.
But if we consider R & D as an investment where we can at least tenfold the money we put in, the decisions behind the project delays is not at all sensible. By setting financial goals for the projects, the management team can evaluate their actions, decisions and the consequences of them correctly to make successful new product development happen.
In the Parmatur App you can follow each focus area in four different views.
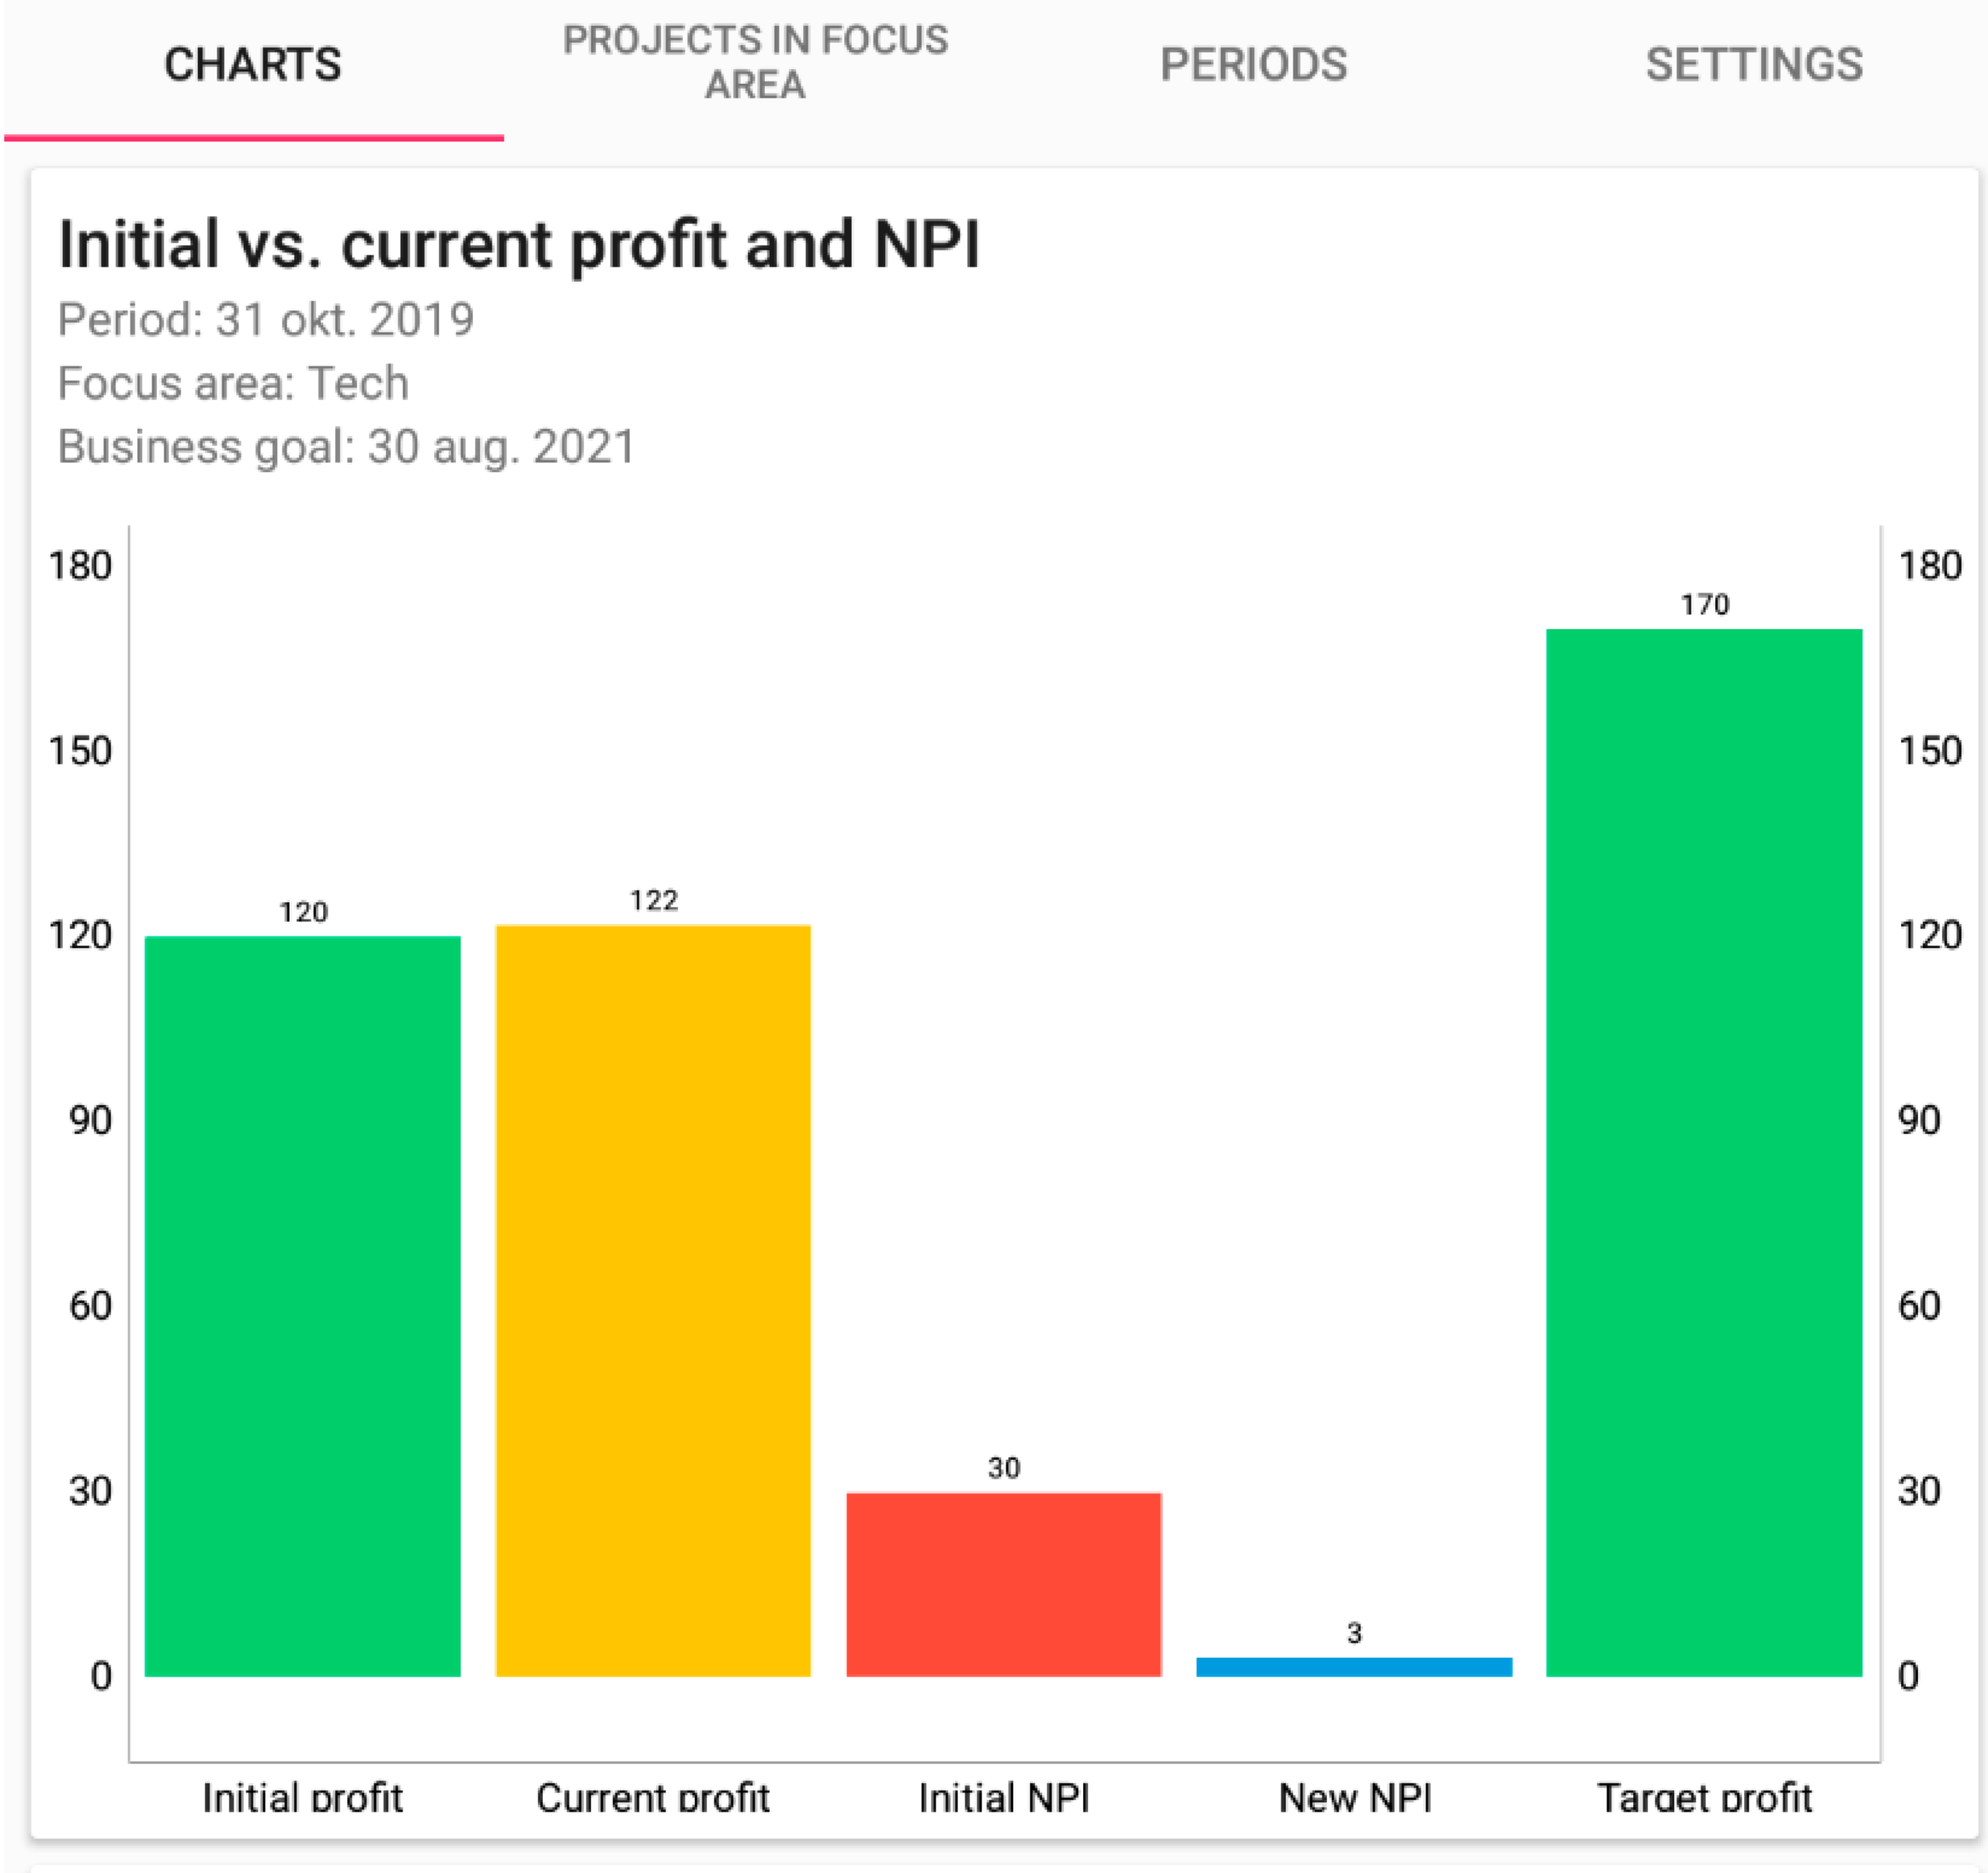
Above is the overview of the focus area. The initial values of total profit and profits from new products (NPI – New Product Introductions) are compared with current profits, business goals and profits for new products that have been launched after the business goal started.
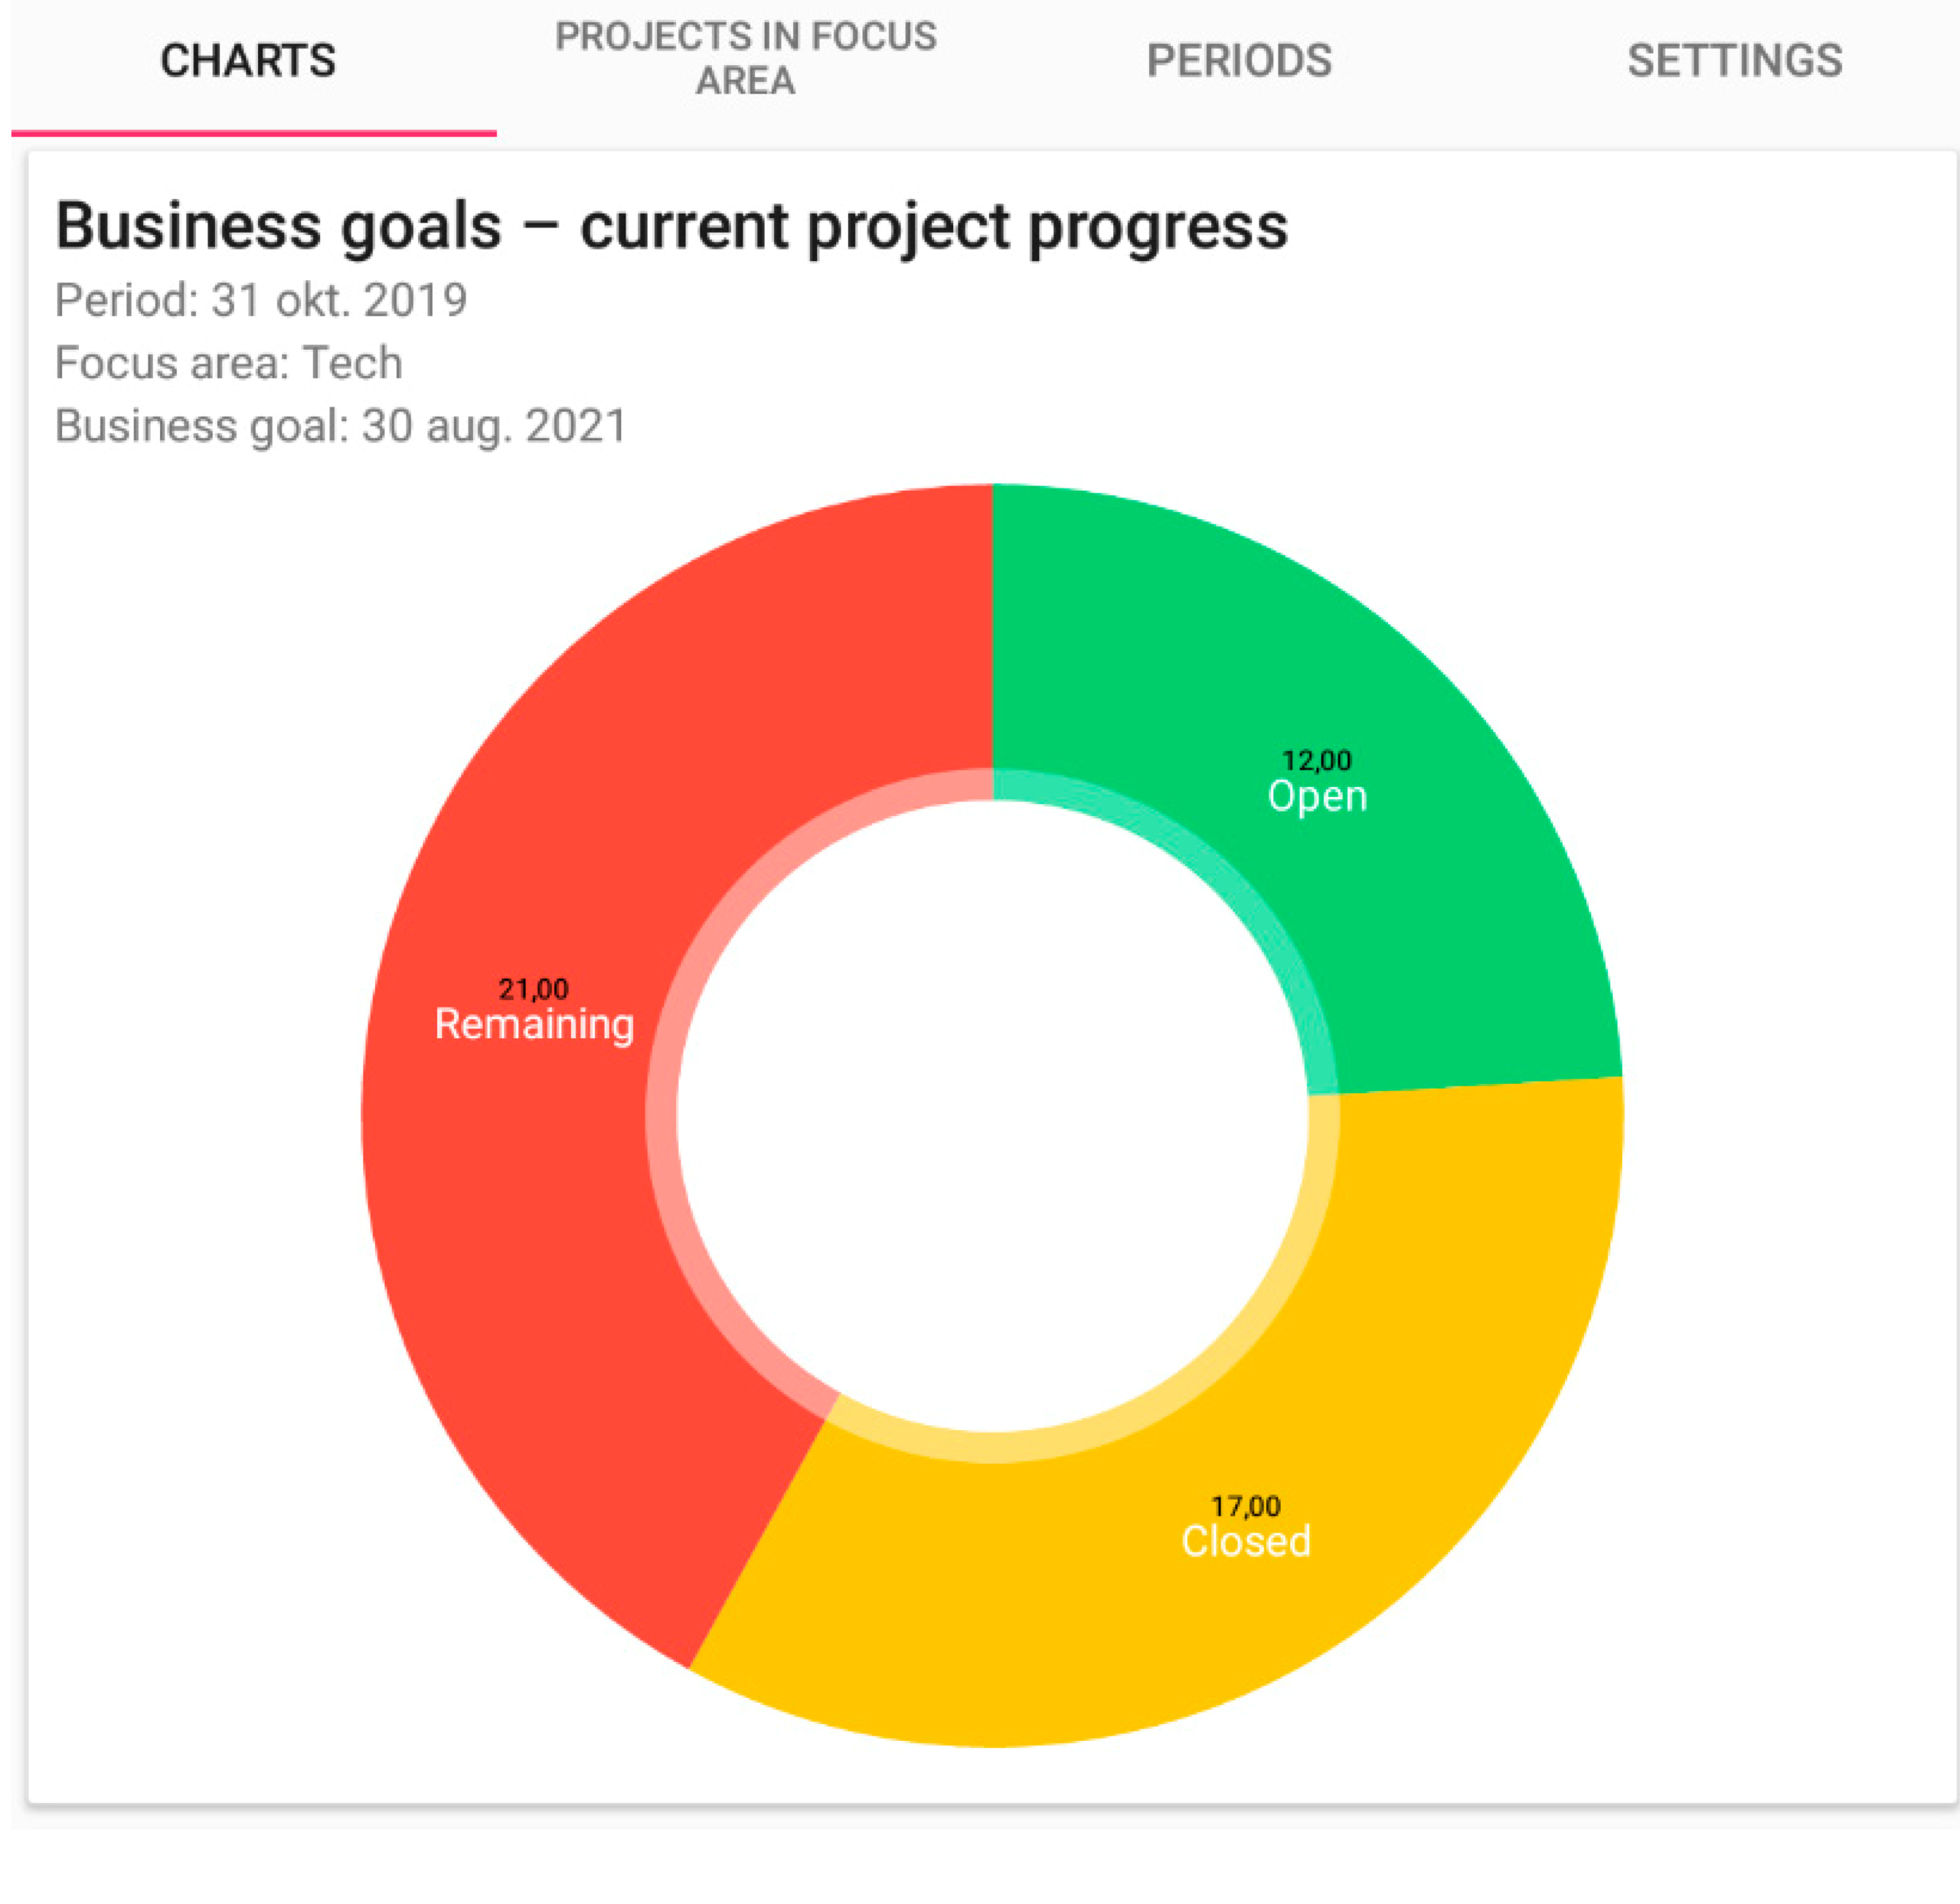
The pie chart shows how much accrued profit has been achieved from completed and ongoing projects, and how much remains to be initiated as projects by the product group. However, the projects’ contributions in this figure are based on profitability analyzes and are therefore expectations. To see the real sales figures we have to go to the next view.
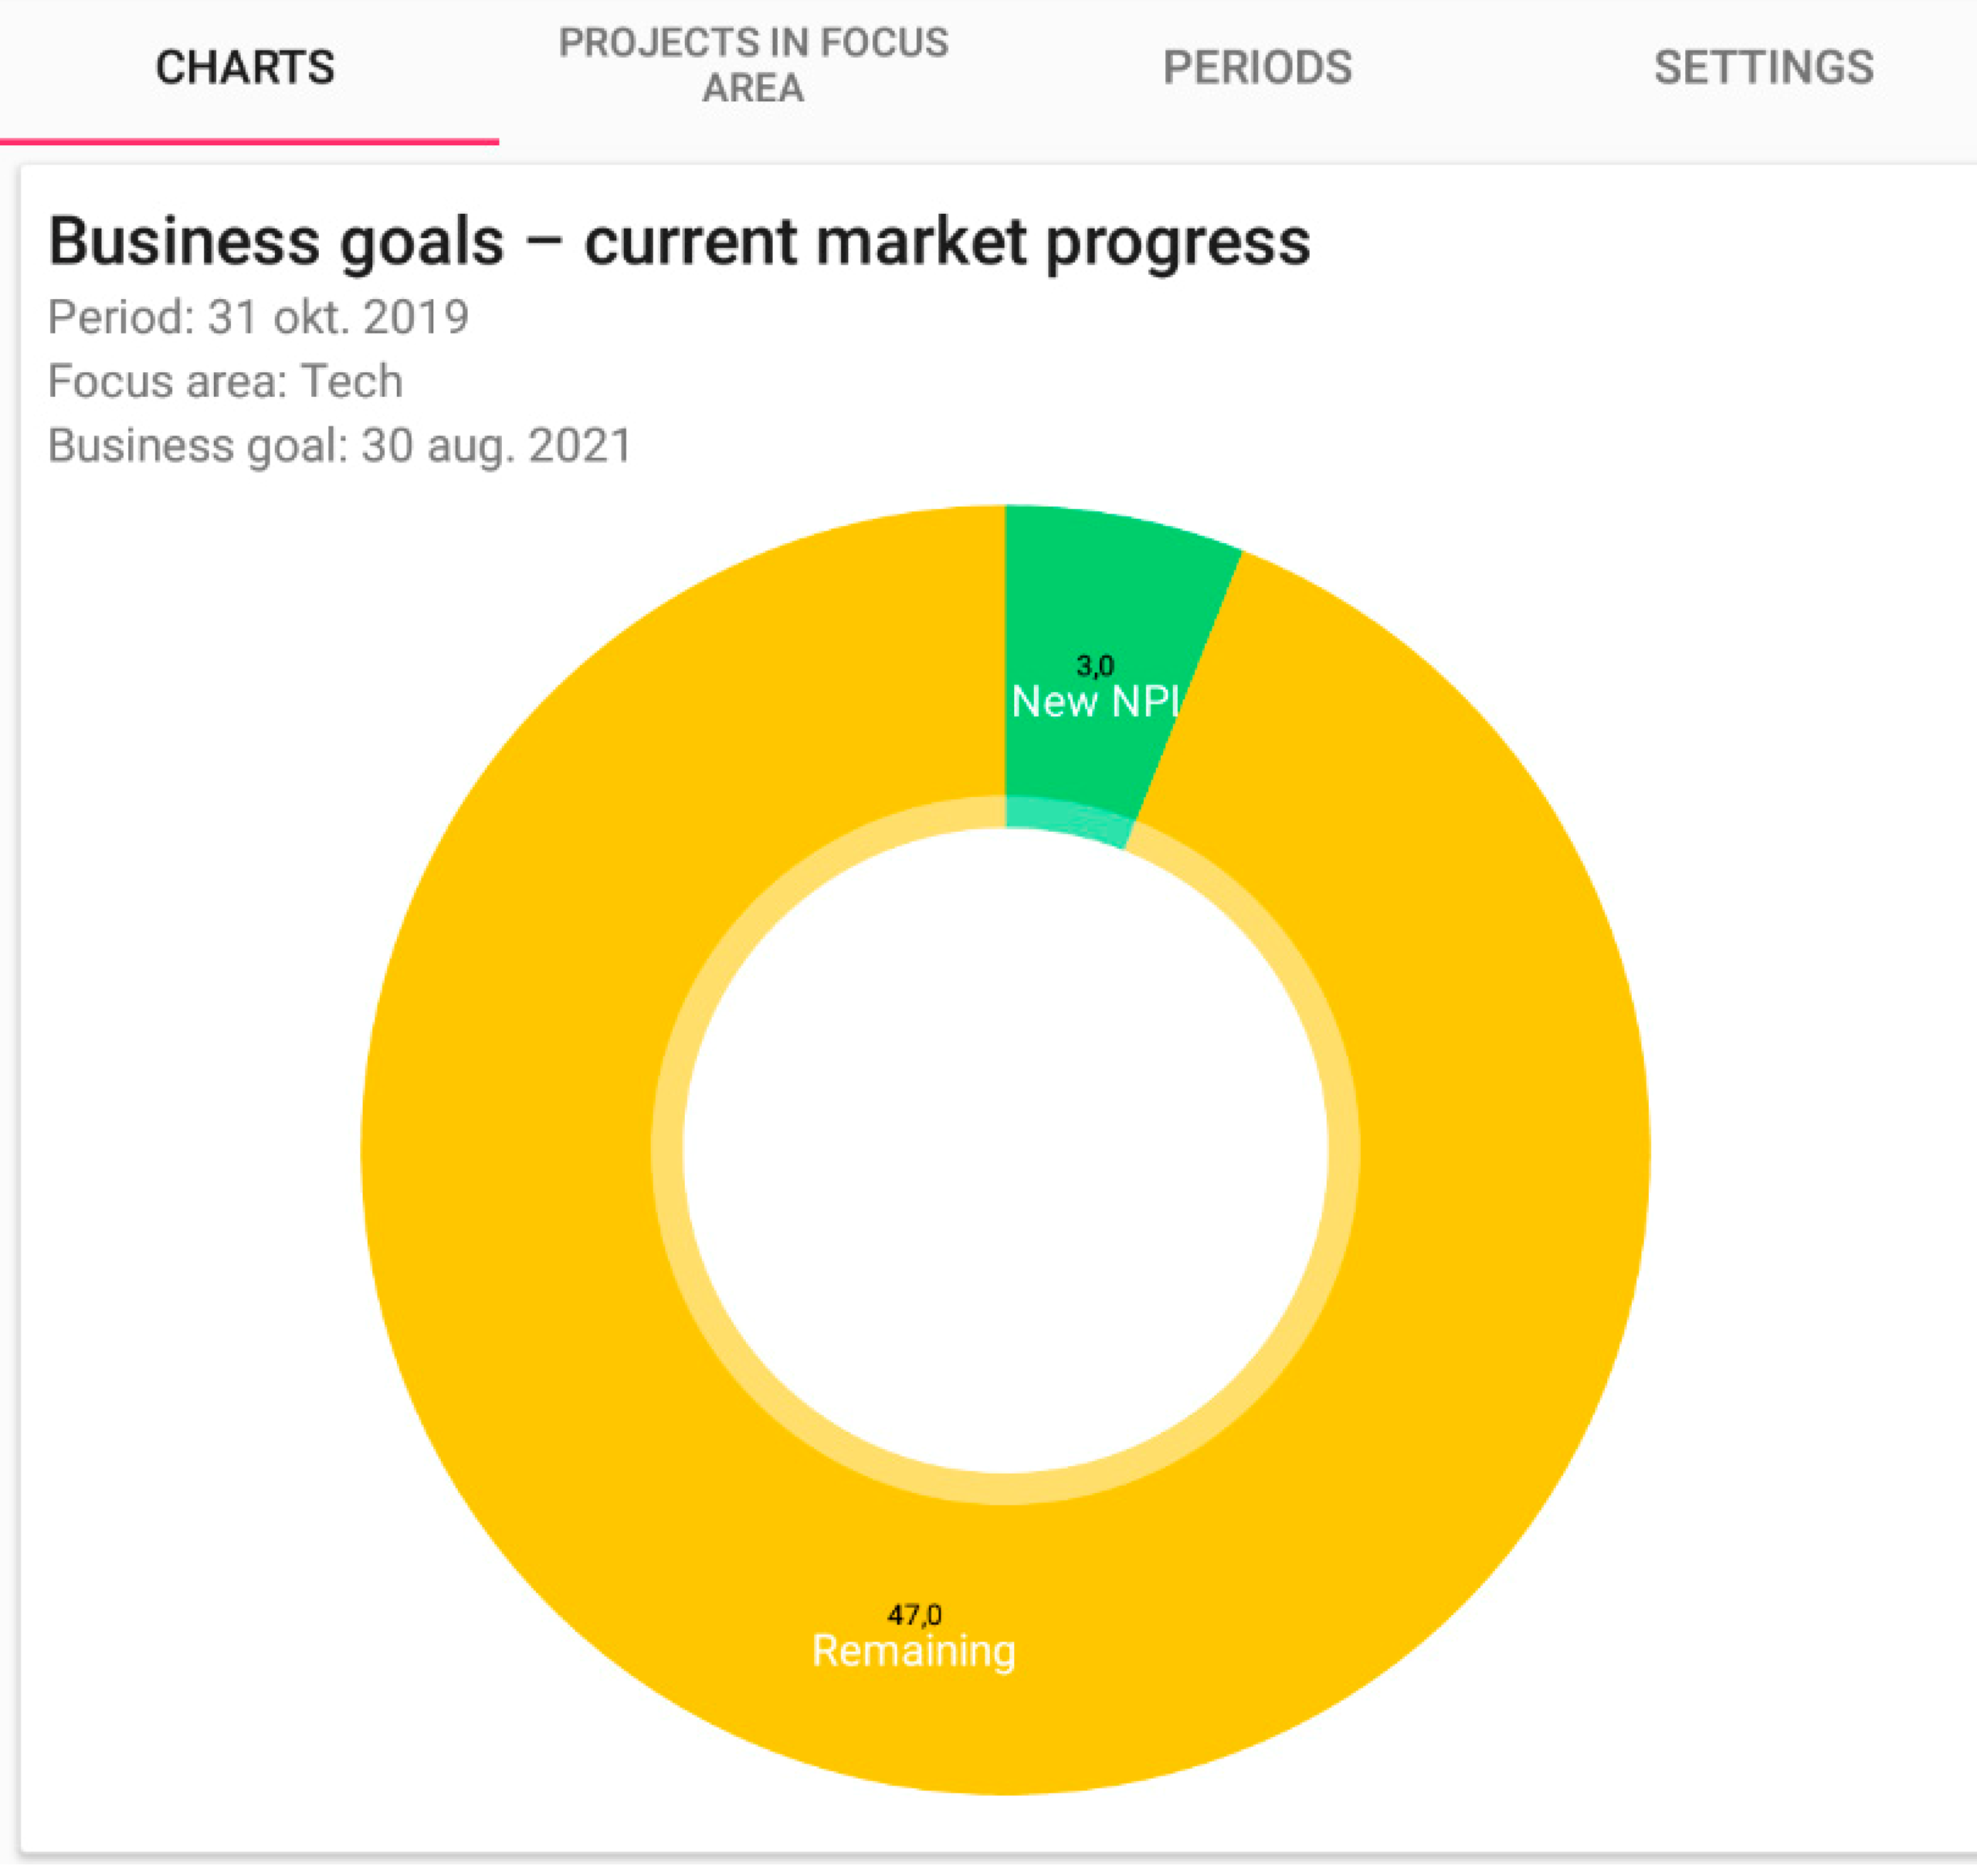
This pie chart shows how much of the business goal has been achieved through increased sales. A focus area will be active over several years. During this period, several projects are initiated and many new products are launched. The sales figures can then be followed for another three years after the deadline.

This view shows the ongoing and completed projects that belong to the focus area and how they contribute to the business goal. Each project is divided into “Completed contribution” and “To be done contribution”, calculated on the basis of the proportion of completed sub-results.
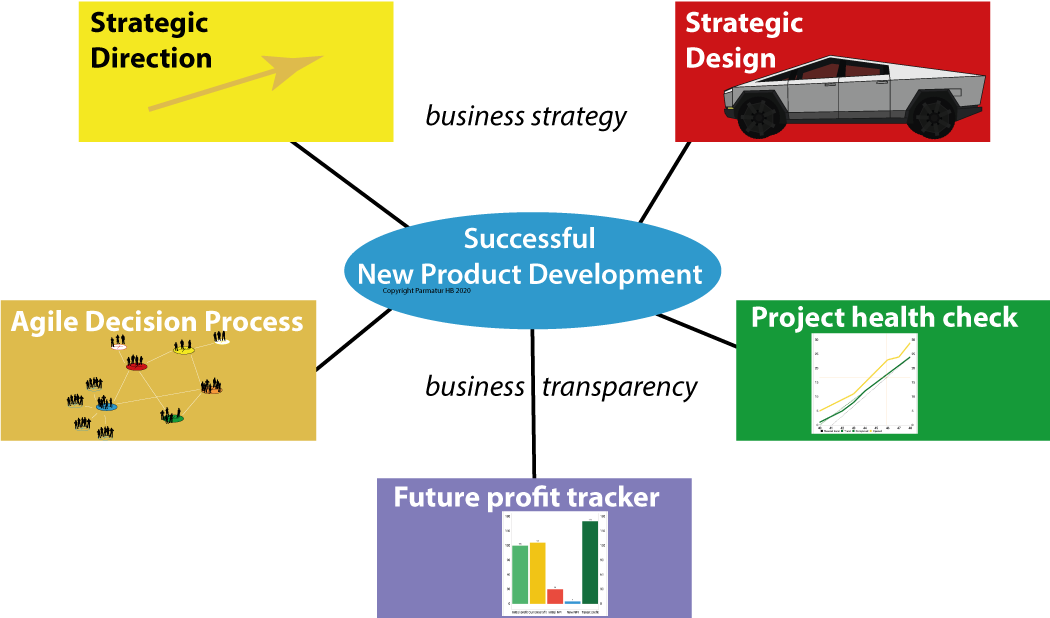
Successful New Product Development
If R&D is treated as an expense that burdens our financial reports, your company is in a race to the bottom. Instead, think of the infinite number of opportunities available to dramatically lower cost-of-ownership for your customers. Then you realize that R&D is building the future, not only for your company but also for humanity. With updated financial figures, the management team can keep R&D and future products on their agenda every week. There is no time to lose.
