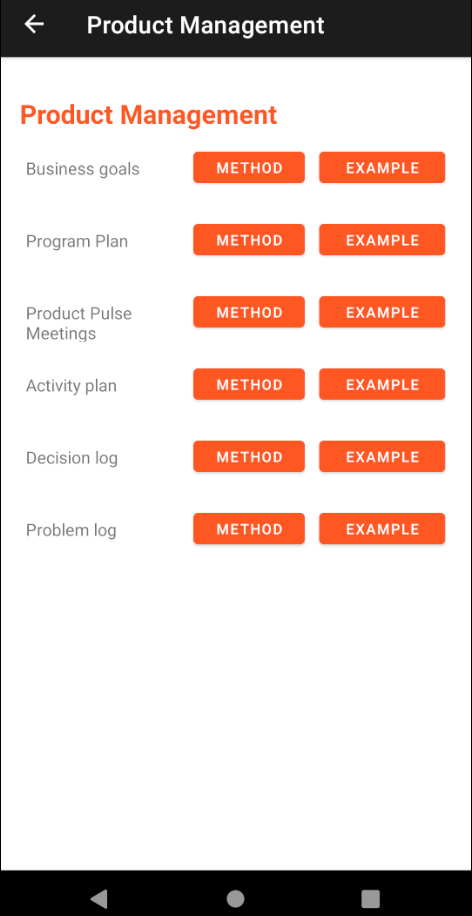
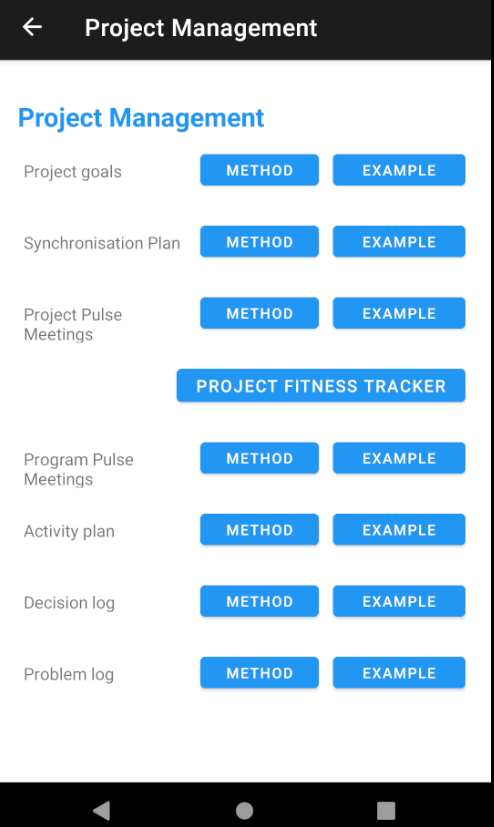
Navigate to find method and examples
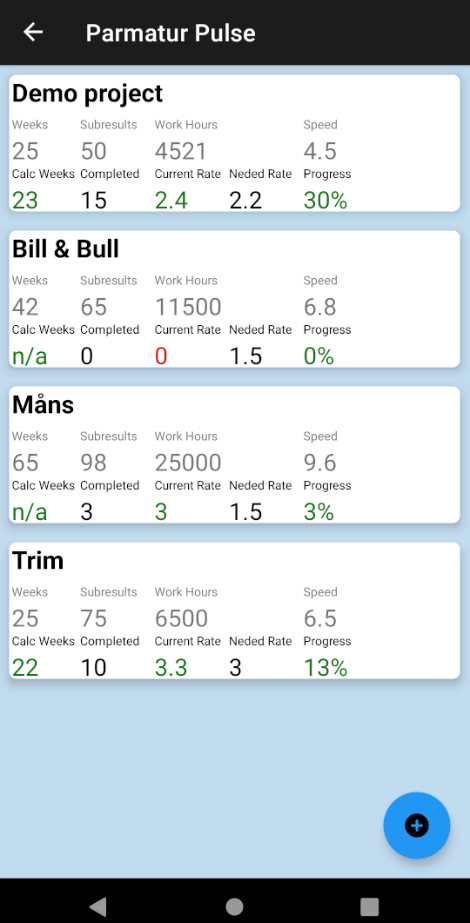
Parmatur Pulse model overview.


Project Fitness Tracker
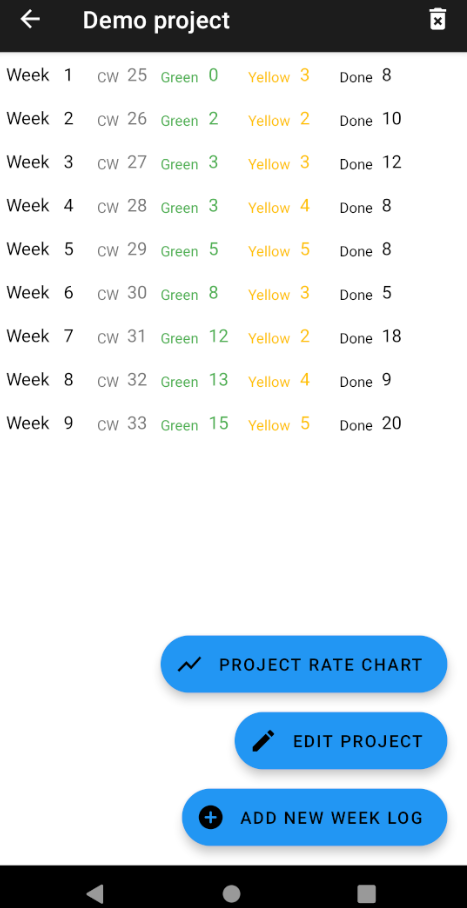
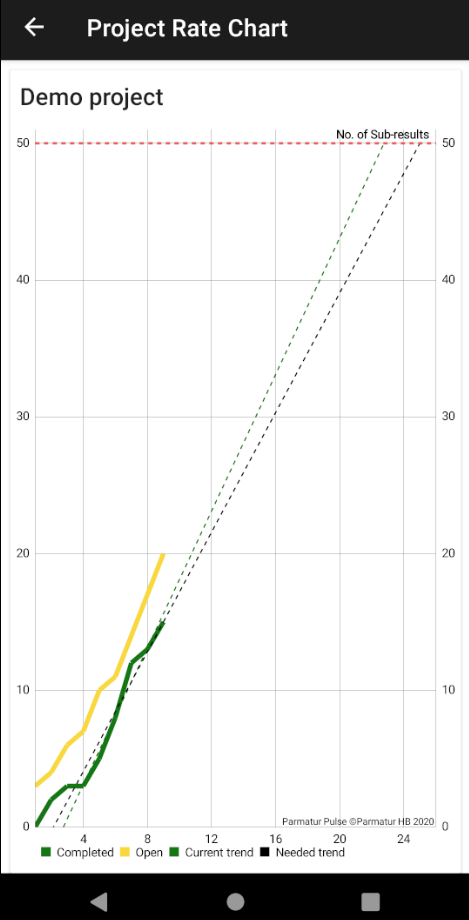
Flow Diagram (opened and completed sub-results) shows the number of completed (green-marked) sub-results and the accumulated number of started (yellow-marked) sub-results for each week.
Needed trend. The black trend line shows the necessary rate to reach the decided finish date.
Current trend. The green trend line shows real trend.
No. of Sub-results. The dashed red line show total number of sub-results that should be done.

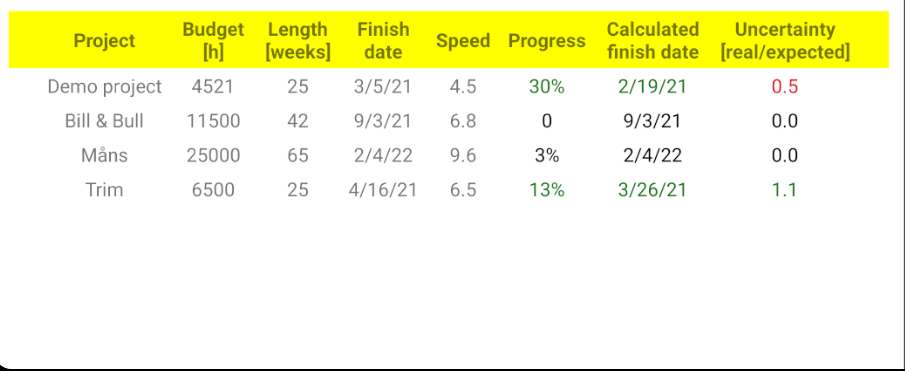
This information is retrieved from Project Details and week logs for all running projects.
Planned is defined in Project details:
- Project – Name of the project
- Budget – Total working hours
- Project length – Total project length (number of week between Start date and Close date)
- Decided finish date – Close date. Calculated based on current date and remaining time based on Project length.
- Speed – Speed forecast calculated as Total working hours / (Total project length * Length of working week) where length of working week is set to 40 by default.
Actual is retrieved from the project’s week log:
- Progress – calculated as Completed sub-results / number of sub-results where the Number of Sub-results is defined in Project details. If the calculated finish date is later than decided finish date + 1 week, the value is displayed in red.
- Calculated finish date – Trend based on the number of Completed sub-results reported in the week log. If the calculated finish date is later than decided finish date + 1 week, the value is displayed in red.
- Uncertainty – Average number of done activities last 5 weeks / expected number, where expected number is Speed x 5 (= one person do one activity per day). Show red bellow 0.8 indicating to large acclivities.
Release notes:
1.1.17 Portfolio with all your ongoing projects. Shows overall fitness for your projects.
1.1.14 Project Rate Chart to visualize current fitness.
1.0.9. Project Fitness Tracker to monitoring projects health included as an option in project management menu.
1.0.0. Methods and examples for the Parmatur Pulse model.

You must be logged in to post a comment.